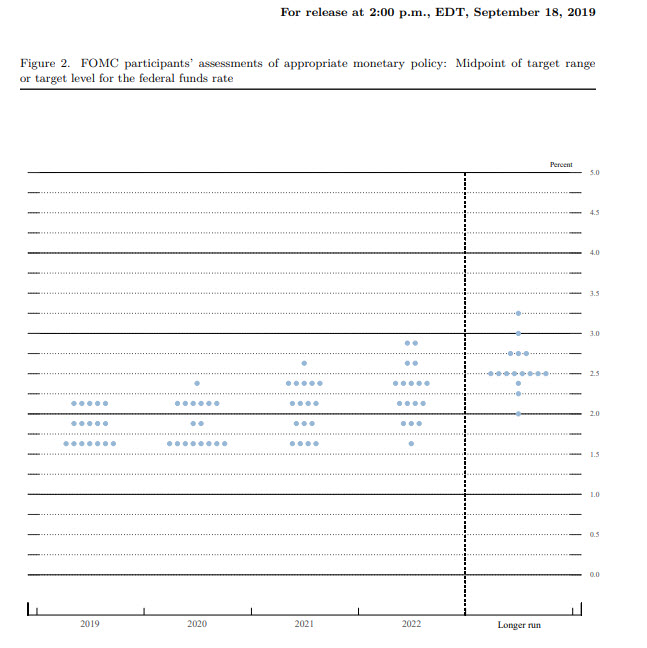
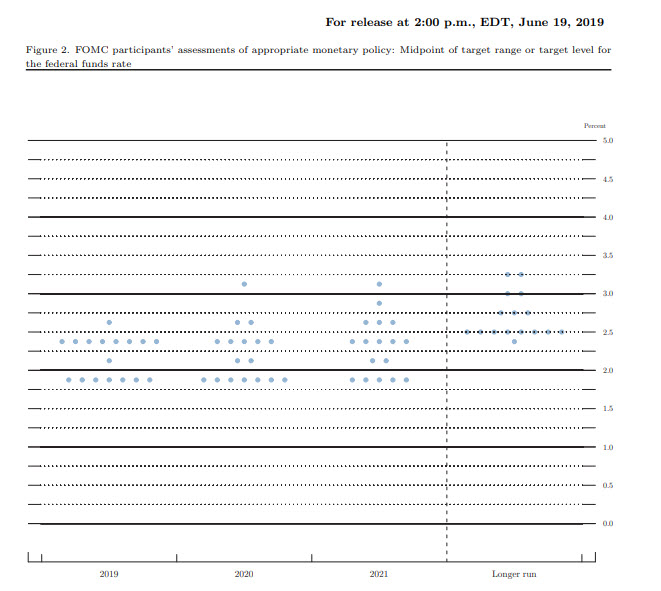
The FOMC dot plot from the September 2019 meeting 19-Sep-19 04:56 am Analysis Anirudh Sethi Dot plot from the September 2019 FOMC meetingThe September 2019 dot plot. The 2019 dot plot came down to 1.9% in 2019. They see 1.9% in 2020 and 2.1% at the end of 2021.The June 2019 dot plot