rss

European stocks end with sharp losses on the day

German Dax -1.5%. UK FTSE -1.15%.

The major European stock in season ending the day with sharp losses. The provisional closes are showing:
  • German DAX, -1.54%
  • France’s CAC, -1.70%
  •  UK’s FTSE, -1.15%
  • Spain’s Ibex, -1.2%
  • Italy’s FTSE MIB, -1.24%
In the benchmark 10 year note sector, yields have continued their trend lower with the larger declines in the more “risky” countries ( Spain Italy Portugal).
German Dax -1.5%. UK FTSE -1.15%.

In other markets, as traders in London/Europe look toward the exits:

  • Spot gold is trading at $3.28 or 0.25% at $1282.61
  • WTI crude oil futures are getting smashed at $-2.04 or -3.42% at $57.11. The oil complexes getting hurt on expectations for weaker global demand

Oil extends decline to more than 2% as sellers eye key technical break amid risk-off mood

WTI is down by 2.4% as price falls below the 100-day moving average

WTI 29-05

Risk-off sentiment continues to be the major theme in trading today and it is also putting a major dent in oil prices as we’re seeing WTI fall by more than 2% on the day now. Price is contesting a firm break of the 100-day MA (red line) and if sellers manage that, it would see the bias in oil turn to being more bearish instead.
Iran sanctions and the more than likely OPEC+ output cuts extension are among factors that should help oil in the medium-term but with markets looking jittery as ever now, it’s hard to rule out a further decline particularly when a key technical break such as this is looming just around the corner.
The move lower in oil and weaker risk tones are part of the reason weighing on the Canadian dollar today with USD/CAD rising above the 1.3500 handle to highs near 1.3520 currently. For the loonie, do be reminded that we still have the BOC meeting decision later today.

10-year JGB yields threaten near three-year low as global bond yields continue to fall

10-year Japanese government bond yields are at their lowest since March, near -0.10%, threatening a fall to its lowest level since September 2016

10-year JGB

  • US yields fell hard overnight – Asia following along. Australian 10 year yield under the cash rate.
  • US 10-year Treasury yields fall to lowest level since October 2017
Bond yields continue to be a key focus area in trading today after we saw US yields tumble overnight. Today, we already saw Australia 10-year yields fall below its cash rate for the first time since 2015 and New Zealand 10-year yields hit a record low as well.
And in Japan, we’re now seeing 10-year yields about to eclipse its March low of -0.10% and hit its lowest level since September 2016.
US-China trade tensions and global growth worries continue to be the key driving factors in the background and given that the outlook is still rather uncertain/cloudy, there could potentially be more pain to come for risk assets.
I made a few mentions earlier in the year that I expect the yen to make a push for being an outperformer in 2H 2019 given the backdrop of a US-China trade deal holding little meaning and that global economic conditions will continue to deteriorate.

“In the bigger picture, I still view that the pair will favour the downside more than it should the upside considering global growth momentum. However, that is likely more of a story for 2H 2019 than the present.” — USD/JPY @ 111.90 in March

However, with a trade deal completely off the table now, I reckon there is a strong case for bringing forward that argument over the next few months.
With Chinese economic data already showing considerable signs of weakening in Q2 and US Q2 GDP forecasts being slashed to almost just 1% now, it’s only a matter of time before this theme starts gathering focus and spread fear across markets.
When it comes to trades like these, there isn’t much planning involved because it is more of a matter of gauging when greed turns into fear (shift in risk sentiment). And such an event can happen like a quick flip of the switch more often than not.

Nikkei 225 closes lower by 1.21% at 21,003.37

Tokyo’s main index closes lower following overnight losses in Wall St

Nikkei 29-05
Asian equities are on the back foot for the most part today after weaker sentiment seen from overnight trading in Europe and US markets. Chinese stocks have recovered some ground after the lunch break but the general mood remains softer as we see the Nikkei end with losses of more than 1% and falling back below its 100-day moving average (red line).
Bond yields in general are also weaker with Treasury yields lower and we’re seeing Japanese 10-year bond yields also fall to -0.1%, its lowest level since March now. That is keeping pressure on yen pairs with USD/JPY holding lower at 109.25 as we begin the session.

Iron ore prices set to fall when supply pressures ease

Explaining the Iron Ore and Australian Dollar divergence

Iron Ore

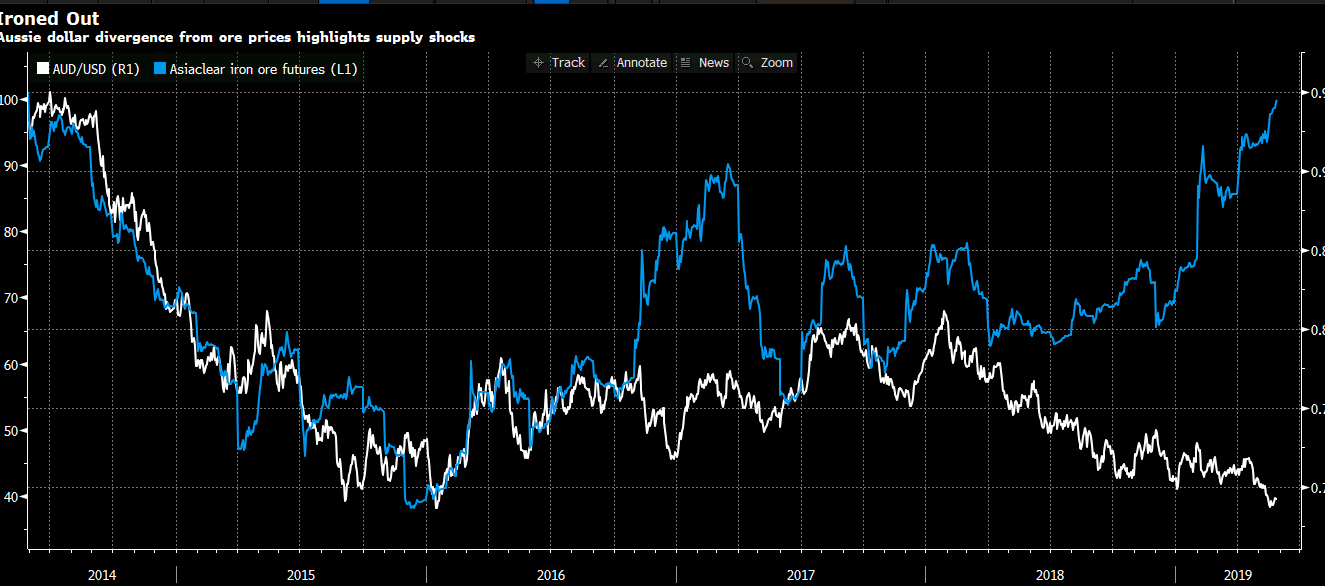
Yesterday Eamonn posted a chart highlighting the divergence between Iron Ore and the Australian dollar. They typically move in tandem, but recently that relationship has broken down. So this raises two questions. Firstly, why have they broken down and Secondly, which one will move to the other first? Will Iron Ore fall, or will the Australian dollar rise?

1. Why has the relationship between the Australian dollar and Iron Ore broken down?

Supply shocks

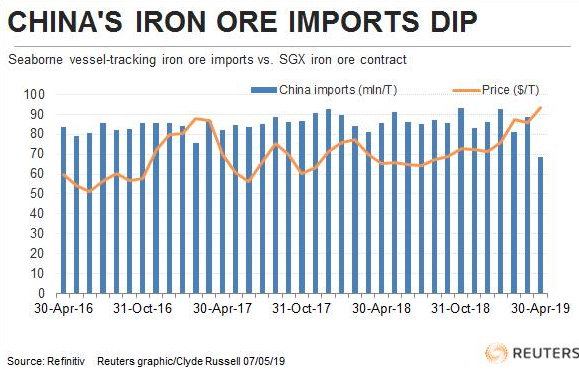
This year there have been a series of supply shocks for Iron ore. According to data compiled by Refinitiv In the first four months of 2019, Brazilian exports were 97.2 million tonnes. That is down from 111.9 million tonnes in the same period in 2018. The top mining company, Val, has been hit by a series of mine closures over safety concerns when a dam burst at the start of the year sadly killing 300 people and raising concerns over the comopanies safety practises.

Australian exports (which accounts for around 50% of global exports) had their exports down reduced from 280 million tonnes to 259 million tonnes in the first four months of the year. If you take these together then the drop from the world’s two top exporters of Iron Ore is 35.7 million tonnes. This is a significant hit to supply. On top of this imports to China are dropping too. Port inventories in China have fallen to 133.6 million in the week to May 5, down from a peak of 162 million tonnes in June last year.

Explaining the Iron Ore and Australian Dollar divergence

2. Which will move first? Iron Ore or the Australian dollar

The concerns over Global Growth have weighed on the Australian dollar and the US-China trade war is currently at a stale mate. Trump is trapped in that he wants a trade war, but can’t go too hard at it or else he will hit US stocks. However,he will keep the pressure up.

In conclusion

In summary, the falling demand in Iron Ore will cause Iron Ore prices to fall once supply picks up. I am expecting Iron Ore prices to move back down now towards the Australian dollar.

Here is the divergence chart between the two via Bloomberg

Iron

BOJ Kuroda speaking – says nothing is perfect

Bank of Japan Governor Kuroda speech in Tokyo, not really adding too much on monetary policy nor his economic outlook.

Headlines via Reuters
  • central banks should continue to examine how best to manage inflation expectations within flexible inflation targeting framework
  • continued low rates can change risk-taking behaviour of financial institutions, affect financial stability
  • no macro-prudential tool kit is perfect
  • prolonged low interest rates in advanced nations could amplify capital flows into emerging, developing economies where inflation and interest rates tend to be higher
  • capital inflows into emerging economies carry risk of economic disruptions such as sudden outflow of capital
  •  two types of risks pointed out on impact of monetary policy financial stability, among them risk of “reversal rate”

More on the US currency manipulation watch list – China

OK, Here is a summary of comments from the report on China (bolding mine):
  • Pursuant to the 2015 Act, Treasury finds that no major trading partner met all three criteria in the current reporting period based on the most recent available data. 
  • Eight major trading partners, however, met two of the three criteria for enhanced analysis under the 2015 Act in this Report or in the October 2018 Report. 
  • Additionally, one major trading partner, China, constitutes a disproportionate share of the overall U.S. trade deficit. 
  • These nine economies – China, Japan, Korea, Germany, Italy, Ireland, Singapore, Malaysia, and Vietnam – constitute Treasury’s Monitoring List. 
  • China has met one of the three criteria in every Report since the October 2016 Report, having a significant bilateral trade surplus with the United States, with this surplus accounting for a disproportionate share of the overall U.S. trade deficit. 
  • Notwithstanding the welcome decline in the scale and persistence of foreign exchange intervention among many major U.S. trading partners in recent years, the Administration remains deeply concerned by the very large trade imbalances in the global economy. The U.S. trade deficit widened further in 2018, and bilateral trade deficits with several major trading partners, particularly China, remain extremely large. The United States is committed to working towards a fairer and more reciprocal trading relationship with China. 
  • Further, global growth is neither sufficiently strong nor balanced. Very large trade and current account surpluses have persisted in several major economies for many years. These imbalances pose risks to future growth, risks which are intensified by the persistence of imbalances. Treasury will continue to press major U.S. trading partners that have maintained large and persistent external surpluses to support stronger and more balanced global growth by reorienting macroeconomic policies to support stronger domestic demand growth, while durably avoiding foreign exchange and trade policies that facilitate unfair competitive advantage.
Go to top