rss

USDJPY reaches the 200 day MA target at 111.44

Look for some additional profit taking against the key MA level.

The USDJPY has reached the 100 day MA target at 111.443. The high price just reached 111.438
Look for some additional profit taking against the key MA level.
I would expect the target would be a tough nut to crack on the first look. Look for selllers/profit takers against the level with a stop above.  If the price can stay below the 200 day MA, a wander down toward the 38.2% at 111.19 and the Asian high at 111.18 would be the target (see the 5-minute chart below).
The USDJPY would target the 111.19 level on the downside if the 200 day MA stalls the rally.

Bitcoin bounces off the 100 hour MA/trend line support

Is it a high for the year?

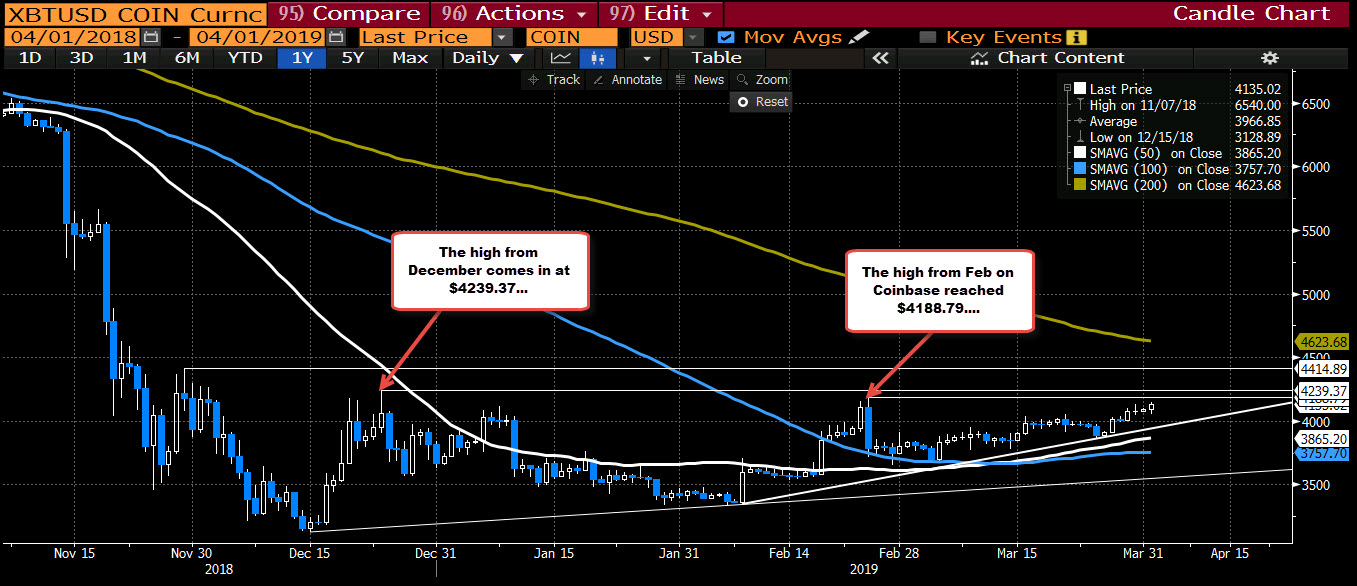
The price of bitcoin is higher on the day and according to Bloomberg, reaching a high for the year.  The problem is Bloomberg uses the weekday trading data.  Coinbase, a leader in digital currency, has the highs for the year on Feb 23 and 24. Those highs came on a weekend.
One of the problems with bitcoin is price transparency.  It bills itself as open at all times. Hence,  I tend to use Coinbase as the benchmark (but it is open for discussion).  However, there may be others that chop out the weekends.
Bitcoin tested the topside trend line
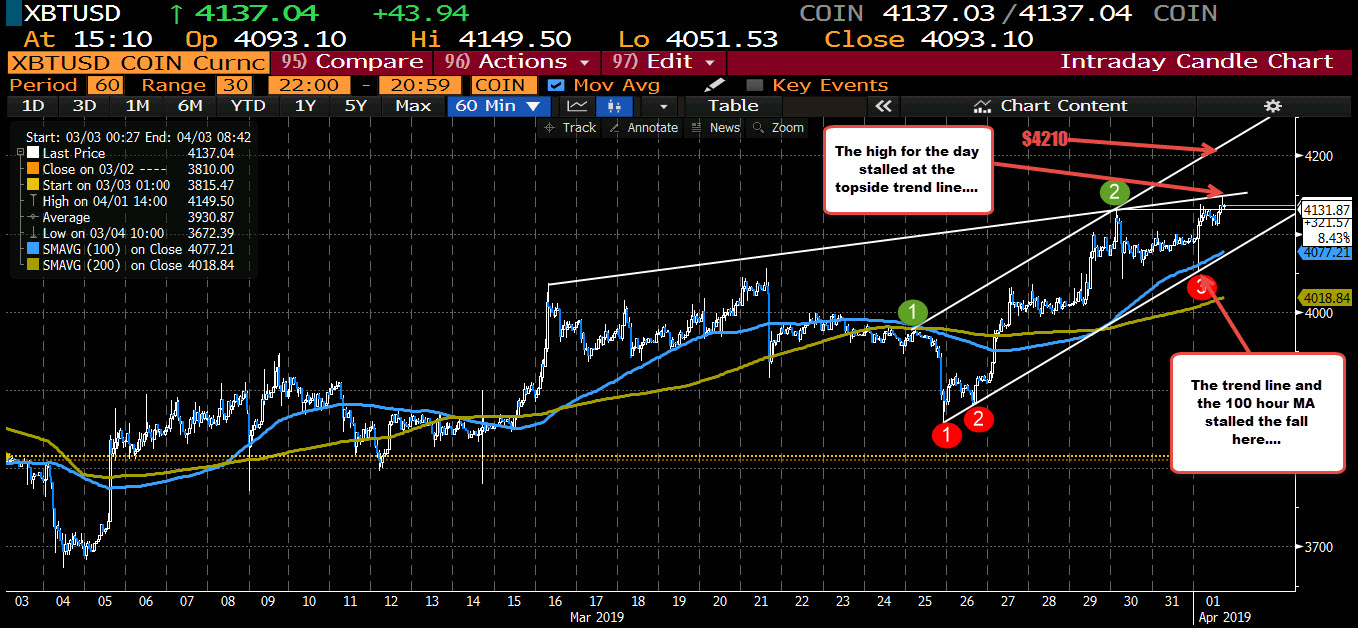
The price is up $43.94 currently on the day at $4137. The high for the day reached $4149.50. The low extended to $4051.53.  At the low, a trend line and the 100 hour MA (blue line) was tested and held support.  Holding the level was more bullish.  The price moved higher.
Staying on the hourly chart, the high for the day did stall against a trend line connecting the March 16, March 30 and high for the day.  Above that is the topside trend line at $4210.  Those are targets.  Before that trend line, the high for the year comes in at $4188.79 (on Coinbase – see chart below).  Keep that level in mind as a target.
Bitcoin on the daily chart

WTI crude nears the 200-day moving average

Oil at the highest since November

Crude continues its 2019 run. it was up more than 35% in Q1 and has started off Q2 with a $0.94 rally to $61.08. That’s the best level since November 12.
Technically, oil is now comfortably in the 50%-61.8% retracement zone of the Q4 rout. The next major level to watch is $61.69, which is the 200-day moving average. Beyond that it’s the 61.8% level at $63.71.
Oil at the highest since November
Fundamentally, I’m increasingly convinced that Saudi Arabia isn’t messing around. Exports to the US are dropping fast and inventories are tightening up. OPEC production in Feb was the lowest since 2015 in a 280K bped drop in the month. The cartel is now tracking at 135% of pledged cuts and Trump’s rhetoric doesn’t seem to be having any effect.
For me, it’s increasingly clear that Saudi Arabia felt burned by the Iran waivers and isn’t going to get burned again. They want to see Brent at at least $70 and as high as $80.

Eurozone March preliminary CPI +1.4% vs +1.5% y/y expected

Latest data released by Eurostat – 1 April 2019

  • Prior +1.5%
  • Core CPI +0.8% vs +0.9% y/y expected
  • Prior +1.0%
After the softer readings seen in France and Germany, the overall headline reading also comes in a tad softer. What’s more worrying though is that the core reading actually fell further to just +0.8% y/y compared to the +1.0% y/y reading in February.
If the ECB is trying to persuade markets that it is still on track to reach its inflation target, the data release here isn’t a convincing sign. EUR/USD holds steady at 1.1248 currently near the highs for the day as the dollar remains weak. EUR/GBP rather unphased as well at 0.8596, a little lower after the pound got a jolt higher from the PMI release earlier.

SNB total sight deposits w.e. 29 March CHF 576.1 bn vs CHF 575.9 bn prior

Latest data released by the SNB – 1 April 2019

  • Domestic sight deposits CHF 488.5 bn vs CHF 489.3 bn prior
Prior week’s release can be found here. Not much change there to the sight deposits data and that suggests the SNB hasn’t really been busy intervening in markets just yet. However, with EUR/CHF on the verge of cracking through a key support level below 1.1200 it’s best to be wary of the potential for them to step in.

China says Liu He has left for Washington for trade talks

US-China trade talks resume in Washington this week

US-China

With markets hopped up on the euphoria from slightly better Chinese PMI figures, let’s not forget that there’s still this to contend with throughout the week. So far, a Trump-Xi meeting to finalise any deal is still not in sight just yet despite constant talks over the past few weeks between both sides.

All eyes now turn to eurozone PMI’s

ECB on a dovish tilt

ECB on a dovish tilt

The Euro is on the ropes with economic growth being scaled back and the ECB making concerned noises about its future path. The revised growth forecasts out earlier this month on March 7 were:

  • 2020 GDP 1.6% vs 1.7% prior
  • 2021 GDP 1.5% vs 1.5% prior

Inflation:

  • 2019 1.2% vs 1.6% prior
  • 2020 1.5% vs 1.7% prior
  • 2021 1.6% vs 1.8% prior


This was on the back of growth forecasts scaled back in December 2018 too. Draghi on Wednesday 27 March last week gave a catchy sound bite to sum up where the ECB were at. He said that the situation was ‘delayed, not derailed’. He also spoke about the resilience of the economy as well as ‘risks being tilted to the downside’. A series of cheap loans to eurozone banks was implemented by the ECB. Known as LTRO’s (Long term refinancing options), the loans provide funding to eurozone banks which the ECB have used in the past and became popular during the financial crisis of 2008. Here was Draghi speaking on the loans on March 27:

The Governing Council also decided to launch a new series of targeted longer-term refinancing operations (TLTRO-III) in order to preserve favourable bank lending conditions and maintain the efficient bank-based transmission of our policy.

These decisions ensure that our policy stance remains accommodative in the face of a weaker growth outlook. And the calibration of the remaining parameters of the TLTRO-III will reflect the evolving macroeconomic conditions. A slew of Eurozone data out shortly will give us an indication of where the dust has settled for now with the poor recessionary PMI readings. Remember how Germany’s poor PMI reading of 44.7 sparked concerns around the middle of March on Friday (March 22). Here was Justin’s instantly insightful comments at the time as he gave the heads up on just how bad a miss that reading was:

Boom! That’s a massive miss on manufacturing/factory sentiment and it is sending the euro to session lows on the day. It’s a third straight contraction for manufacturing PMI but the size of the miss here is really what is driving the euro lower at the moment.For some context, the manufacturing print is the lowest since August 2012 while the composite print is dragged lower as a result to its weakest print since June 2013.

All eyes now turn to the euro PMI’s.

ECB GDP


Go to top